To access this information, go to the "Dashboard" menu, "Local SEO" tab.
On this tab, you will be able to access 2 types of data, which you can analyze over different periods thanks to the filter options:
- The key indicators of your performance on Google My Business
- Charts to analyze each of these indicator
Key metrics for your Google My Business listing
When a visitor searches Google (or Google Maps), your Google My Business listing may appear in the list of results.
From there, Google informs you about the type of interaction it had with your listing using 3 indicators: number of views (1), number of actions (2) and number of calls ( 3).
Convert your visitor in 3 steps with your Google My Business listing
The 3 key performance indicators mentioned above allow you to follow your customer's journey and identify your progress.
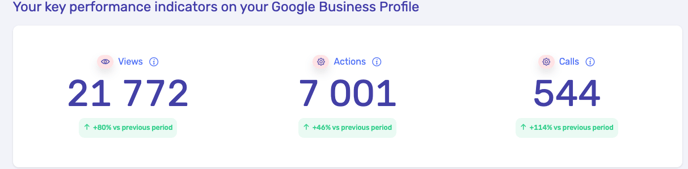
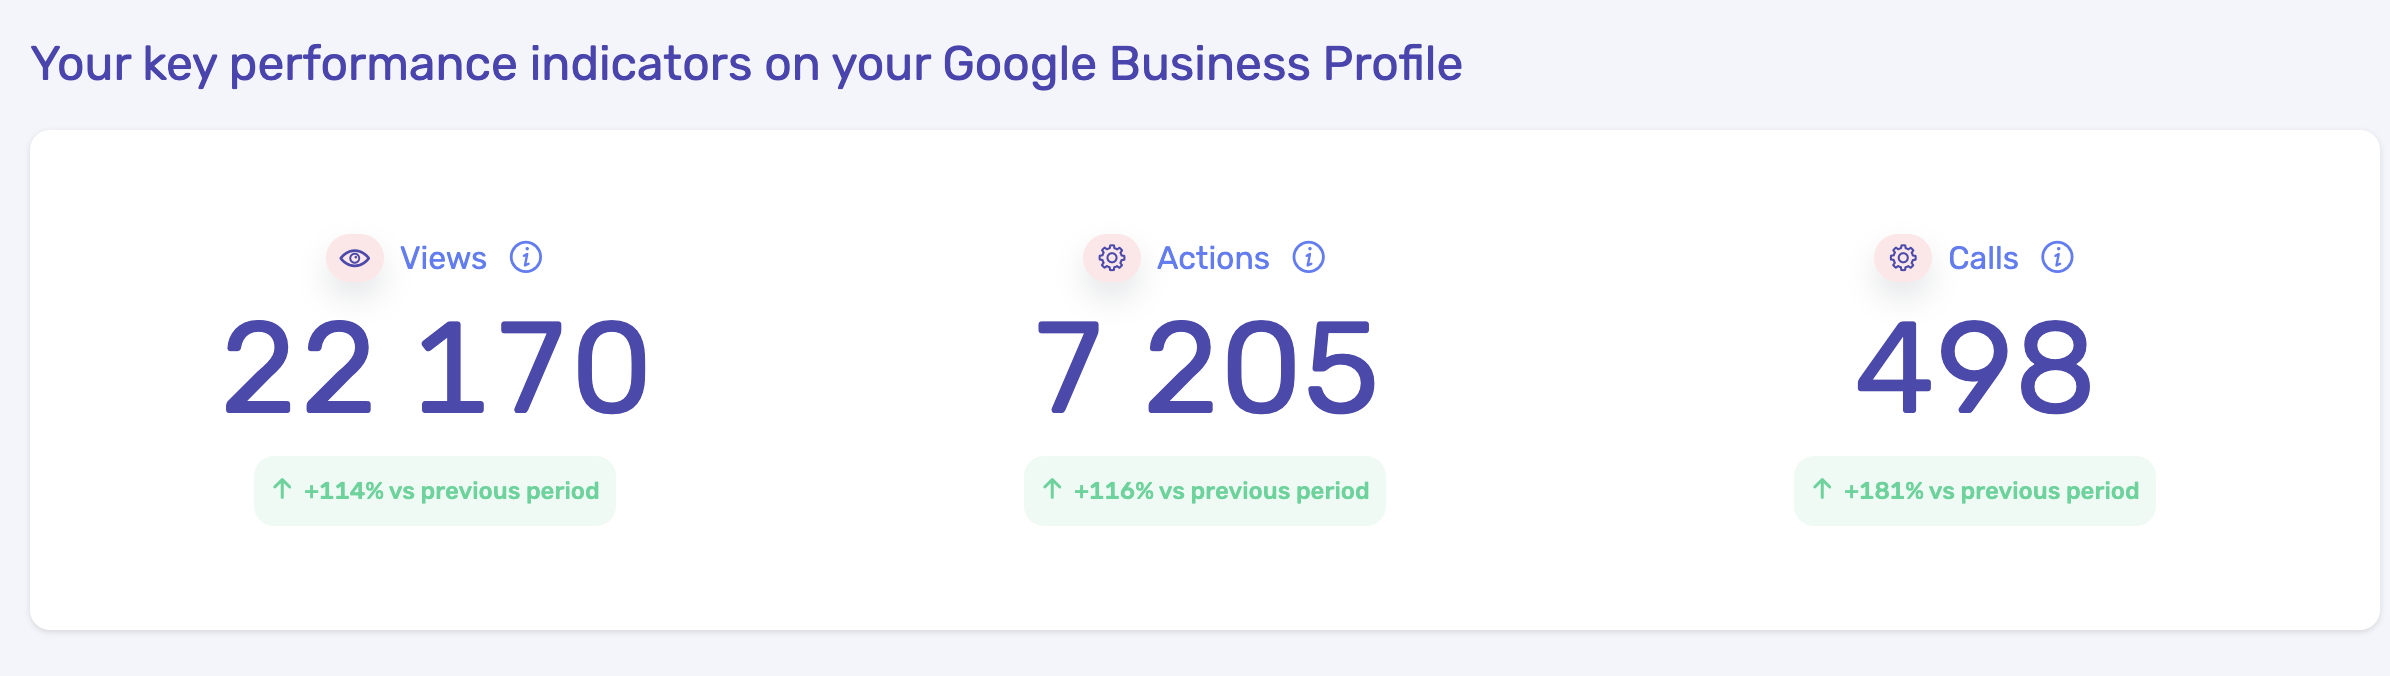
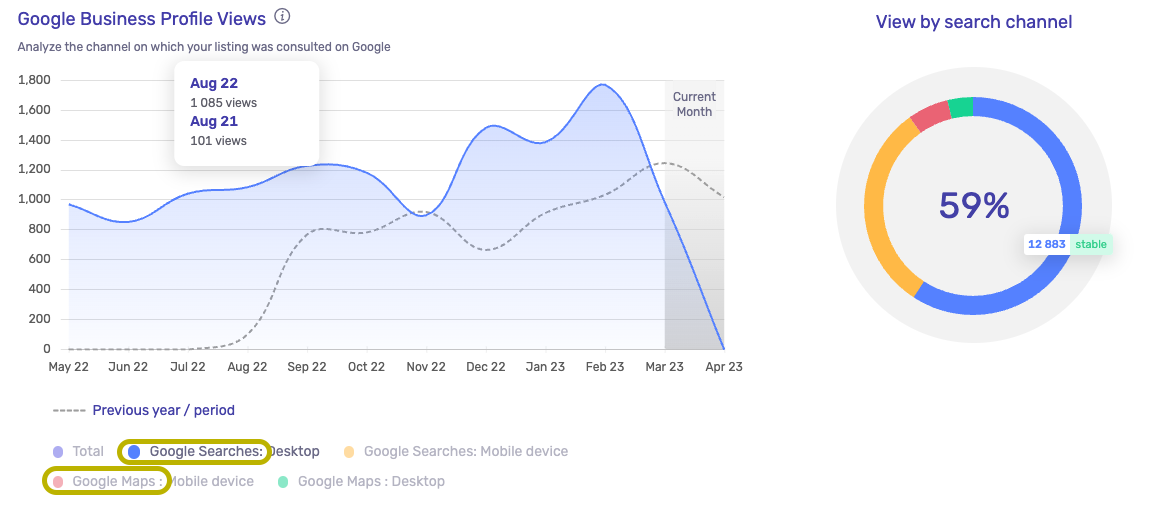
1. Number of views
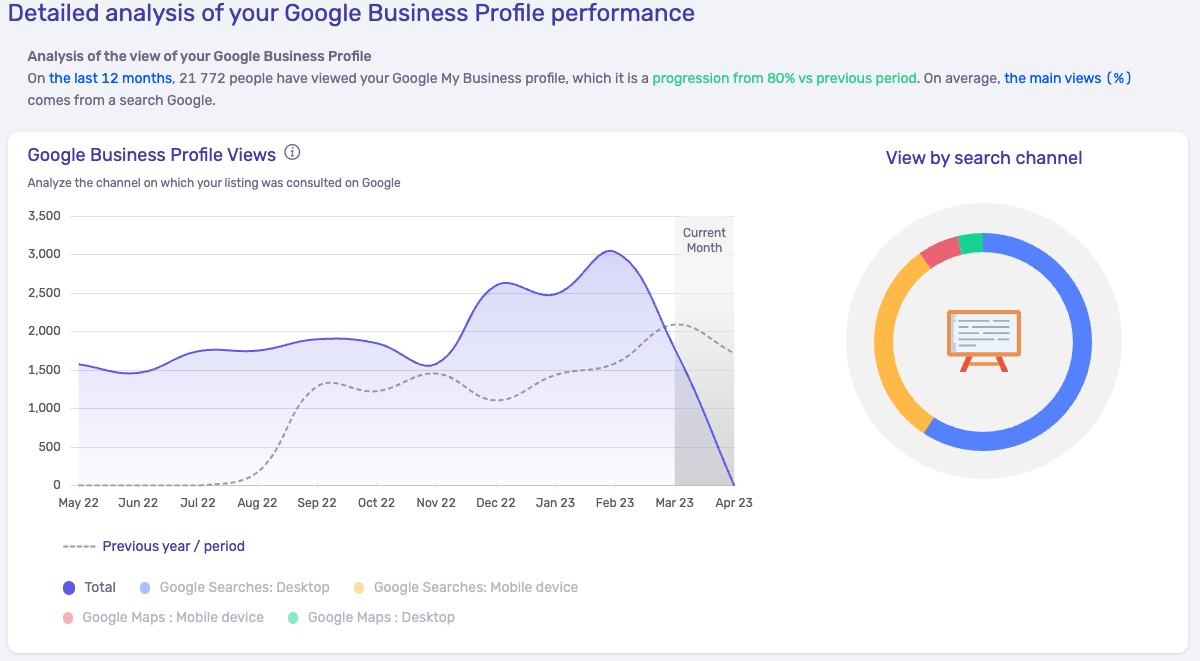
The count displayed in the “Views” section corresponds to the number of times your Google My Business listing has actually been seen by your prospect.
The dedicated graph that follows allows you to deepen your analysis by separating the views of Google and Google Maps.
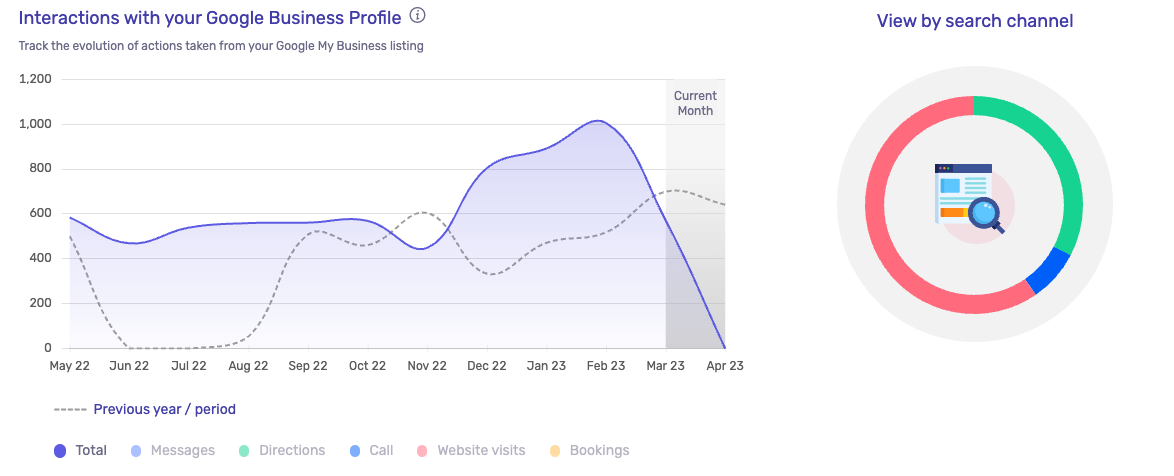
2. Number of shares
The count that appears in the “Actions” section corresponds to the number of actions that have been performed on your Google My Business card.
A high score on this indicator means that you are not only visible to search visitors but that the content you offer is commercially relevant.
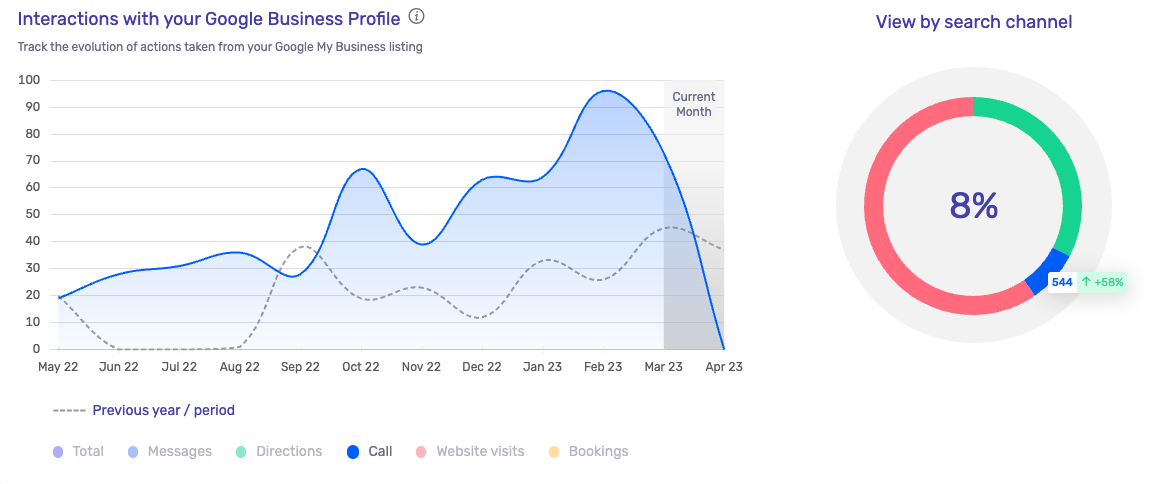
Your visitor can interact with your Google Business Profile in several ways:
- Visit your site
- Consulting your telephone number
- Directions to get to your establishment
- Consultation of photos of your establishment
- View photos posted by customers
- Clicks on an action button (ex: Learn more, Order…)
You can find all these interactions in the "interactions" chart.
3. Number of calls
The count displayed in the “Calls” section corresponds to the number of calls made from your Google My Business card.
The dedicated graph will allow you to see your percentage of calls received over the months, and also to compare them with a selected period.